Welcome back to our irregularly scheduled programming!
We kicked off 2014 by participating in the Grow Your Dough Throwdown with the intention of learning about different styles of investing and demonstrating how simple investing can really be.
The idea was for bloggers to grow $1000 over the course of a year. Participants invested the money however they wanted and the results were compared. Well 2014 has come and gone- and the final results from the GYDT came out a while ago. Read on to find how my portfolio, The Index Strikes Back, did for the year.
Do…or Do Not
My biggest hurdle when I started investing was deciding on where to invest the money I had carefully saved. Do I pick stocks, bonds, ETFs or mutual funds? I didn’t know what stocks to pick, didn’t have enough confidence to buy ETFs and had read about the negative effect of Management Expense Ratios on mutual fund returns. Instead, I read about a special type of mutual fund called an index fund which offers broad diversification at a low cost. So it came down to a decision: let my money sit “under the mattress” or to figure out how to make it grow.
I invested my $1000 in TD e-Series Index funds dividing Canadian, US and International equity into the following allocations. I left out a fixed income bond index, feeling it was worth the risk for the short term purpose of this exercise. With these funds, I invested in 1664 companies in multiple industries spread out all over the world.
| DESCRIPTION | ASSET ALLOCATION | FUND |
| Canadian equity | 20% | TD Canadian Index – e (TDB900) |
| US equity | 40% | TD US Index – e (TDB902) |
| International equity | 40% | TD International Index – e (TDB911) |
| Canadian bonds | 0% | TD Canadian Bond Index – e (TDB909) |
Punch It
Here’s the snapshot of the portfolio’s performance for the year, ending December 31, 2014.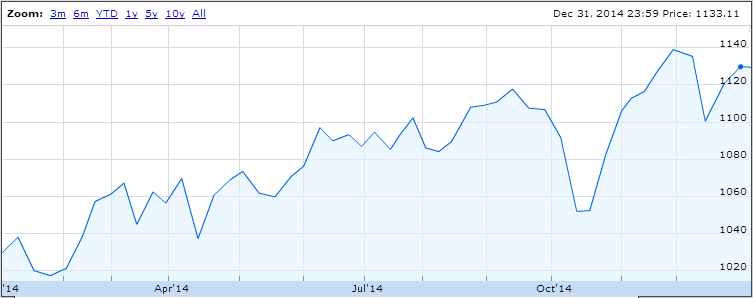
| DATE | VALUE | PERFORMANCE |
| January 31, 2014 | $1,017.46 | 1.93% |
| February 28, 2014 | $1,062.64 | 4.44% |
| March 31, 2014 | $1,062.67 | 0.004% |
| April 30, 2014 | $1,069.86 | 0.68% |
| May 31, 2014 | $1,076.29 | 0.60% |
| June 30, 2014 | $1,084.32 | 0.75% |
| July 31, 2014 | $1,088.98 | 0.43% |
| August 31, 2014 | $1,109.05 | 1.84% |
| September 30, 2014 | $1,103.13 | -0.53% |
| October 31, 2014 | $1,108.35 | 0.47% |
| November 30, 2014 | $1,141.15 | 2.96% |
| December 31, 2014 | $1,133.11 | -0.70% |
| YTD | 13.52% | |
| Note | *Calculated using Modified Dietz Method |
After costs, my initial $1,000 investment turned into $1,133.11 for a growth of 13.52%.
The Competition
In the 2014 GYDT March Update, the Index Strikes Back was up 6.46% with a value of $1,062.67. My portfolio sat comfortably in 5th position of the 14 contestants reporting in.
By the end of July 2014, the portfolio was up 9.10% to date with a value of $1,088.98. The result was also good enough for 5th of 14.
Where do you think the Index Strikes Back will place? Oh the suspense!
The GYDT final results post revealed that the 1st and 2nd place winners came in with portfolio values of $1327.05 and $1313.55, respectively. Unfortunately, all others contestants were relegated to obscurity and a year-end chart wasn’t published. So I did a little digging around and found some year-end values from around the web. For the portfolio’s I couldn’t find, I just filled in the blanks assuming their balances from the GYDT November update as their year-end value. Not exactly accurate, but good enough.
| Rank # | Blog Name | Portfolio Name | December 2014 |
| 1 | PT Money | Signal Speculator | $ 1,327.05 |
| 2 | Dough Roller | Buy it Like Buffet | $ 1,313.55 |
| 3 | House of Rose | Purple Passion | $ 1,133.16 |
| 4 | Urban Departures | The Index Returns | $ 1,133.11 |
| 5 | Frugal Rules | $ 1,121.69 | |
| 6 | Young Finances | Gemini Portfolio | $ 1,097.06 |
| 7 | Good Financial Cents | Prosper | $ 1,086.51 |
| 8 | Good Financial Cents | Betterment – So Easy | $ 1,060.82 |
| 9 | Working to Live | Julie’s Investment Experiments | $1057.58 (Nov) |
| 10 | Afford Anything | Blindfolded Monkey Experiment | $ 1,057.19 |
| 11 | Good Financial Cents | Lending Club | $ 1,050.93 |
| 12 | Planting Money Seeds | Super Boring Dividends | $ 1,038.42 |
| 13 | Good Financial Cents | TradeKing The Blue Chippers | $ 1,032.41 |
| 14 | Good Financial Cents | Motiff – The New Kid on the Block | $ 1,032.18 |
| 15 | Free From Broke | $1020.00 (Nov) | |
| 16 | Consumerism Commentary | Feemageddon | $ 1,010.38 |
| 17 | The Military Guide | Boring Investment Portfolio | $965.00 (Nov) |
| 18 | Canadian Finance Blog | Canadian Dividends | $960.31 (Nov) |
| 19 | The College Investor | $952.36 (Nov) | |
| 20 | Stacking Benjamins | $915.6 (Nov) | |
| 21 | Investor Junkie | Grow your..Doh! | $754.4 (Nov) |
| 22 | Good Financial Cents | Not-a-stock-picker portfolio | $ 551.73 |
After spending most of the year in 5th, I ended the year in the top 20%: 4th out of 22 – by $0.05. I’m going to call it.
It’s a tie for 3rd.
The Last Word
According to the SPIVA U.S. Scorecard Year-End 2014 study, the S&P 500 returned 13.69%. Using a low cost passive indexing approach, the Index Strikes Back portfolio came pretty close, returning 13.52%. Based on data from the study, that puts me ahead of 86.44% of large-cap fund managers underperformed the benchmark.
I spent about 15 minutes to invest the money in the account. I left it untouched for 12 months. It turns out I beat professional full time money managers with minimal effort. Seriously, that’s insane!
When I first started out, I had my doubts as to whether or not an approach this simple could be effective. It’s not rocket science- you get the returns of the market and if this exercise showed anything, is that market returns do just fine over time. This exercise though, was an example of investing in the short term. It’s great that the value went up for the year, but the idea of investing is to leave the money untouched for as many years as possible. How much would it grow to be if left for 10, 20 or 30 years?
With historical rate of return of the S&P 500 at 9.5% per year (according to The Little Book of Common Sense Investing), $1000 could potentially compound to $15,220.31 after 30 years. Start saving up!